UNDERSTANDING FINANCIAL PLANNING WITH THE VENN DIAGRAM

A Tool of Many Extraordinary Applications
The Venn Diagram, named after John Venn, has been found to be extremely useful in mathematics, engineering, software logic, financial planning, business development, politics, and even marital relationships. Understanding it can help you make or save a lot of money, reduce your risk exposure, and have greater peace of mind.
UNDERSTANDING VENN DIAGRAMS IS ACTUALLY EASY!
Number Sets A & B
We start by looking at 2 sets of numbers, but this works just as well in examining things or concepts.
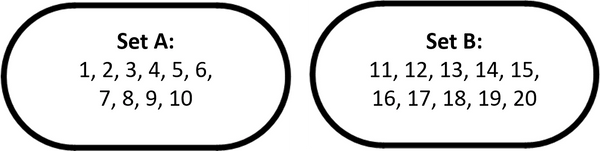
First, notice Set A contains whole numbers between 1 and 10,
while Set B contains the whole numbers between 11 and 20.
Both sets of numbers are completely unique,
so they reside in their own separate ovals.
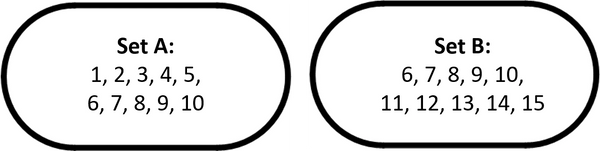
But What If We Change Set B?
What if we changed Set B to contain the whole numbers between 6 and 15?
Now, Sets A and B have the common whole numbers between 6 and 10.
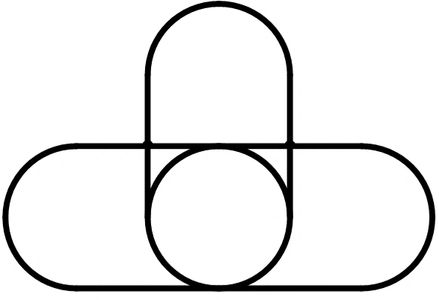
Therefore, both sets actually overlap and are more accurately brought together as below:
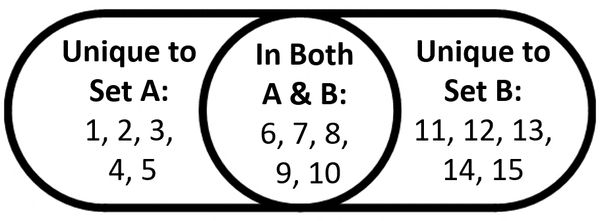
The Union of Set A & Set B
The circle in the middle shows the numbers that are included in both Sets A & B. This visualization makes it easier to understand not only numbers but ideas that are shared between groups.
Now you understand Venn Diagrams!
A POLITICAL EXAMPLE
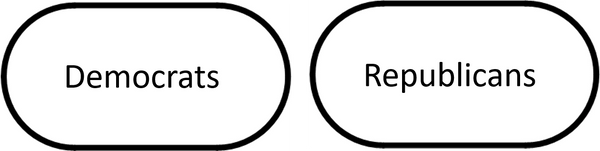
Completely Separate Ideas?
Some people would have you believe that Democrats and Republicans are completely different — polar opposites. However, this is false. Both Democrats and Republican love their children, like healthy delicious food, believe in freedom, believe in science and the profit motive of business, believe in taking care of workers and more.
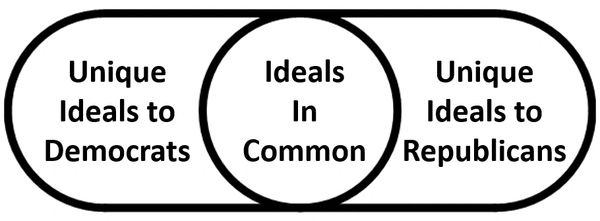
There is Actually a lot of Common Ground
The acknowledgement of the reality of much commonality allowed the parties in the past to come together and solve problems "across the aisle."
The recent trend of extreme polarization has become very dysfunctional, and the media on both the left and right are partly to blame.
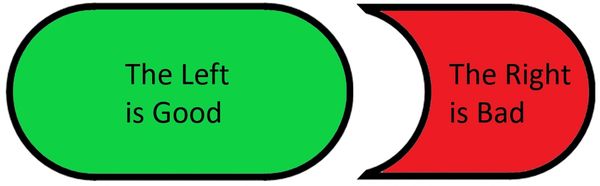
The Liberal Media Constantly Tries to Make One Argument
They only bring up the subset of facts that tries to make their side look like it is only good and the other side is only bad.
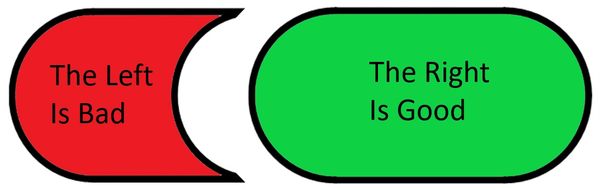
The Conservative Media Tries to Do the Same Thing
In both cases there is some truth and some falsehood. The Venn Diagram reveals something closer to the truth, as you can see the logic flaw below:
Remember: The Numbers Represent Ideas
The arguments above try to strip a portion of the reality of Both Set A (Democrats) and Set B (Republicans). For example, the Left tries to suggest that the Right is only represented by numbers 11 through 15; when in reality, Set B (Republicans) believe in ideals 6 through 15. They miss the very important fact that Republicans also believe in the ideals 6 through 10.
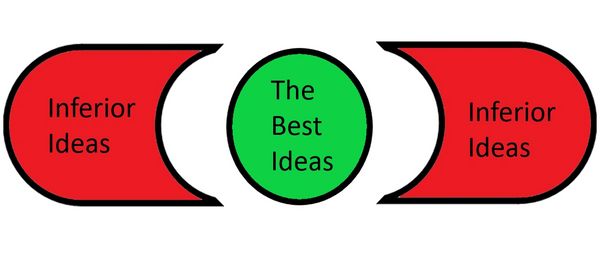
The Best Ideas Usually Take All Stakeholders Into Consideration
It is often necessary to cut off the Extreme Left and Extreme Right, because the ideas falling outside the area of common ground often fail to take all stakeholders into full consideration.
The best ideas almost always come from within the overlap, because these ideas do take all stakeholders' interests at heart.
BUT THE VENN DIAGRAM GETS EVEN BETTER!
Because the Venn Diagram Doesn't Have to Stop at Two
Because the Venn Diagram Doesn't Have to Stop at Two
Because the Venn Diagram Doesn't Have to Stop at Two
In the example above with Democrats and Republicans, there were on two groups, but in reality there are frequently three or more.
Keep Adding Stakeholders
Because the Venn Diagram Doesn't Have to Stop at Two
Because the Venn Diagram Doesn't Have to Stop at Two
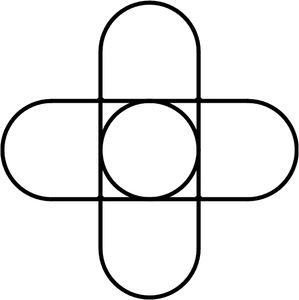
There is no limit to the number of stakeholders that can be added.
The Optimal Solution Finder™ (OSF™)
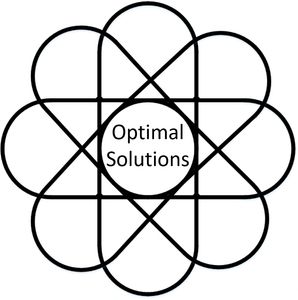
Epiphany
Austin had an epiphany when he realized how these mathematical Set-Logic Diagrams could be used in thousands of applications to find what he now calls The Optimal Solution Finder™.
Austin used this model when solving complex industrial applications when he worked as the Acting Deputy Director of CalBIZ in California Governor Brown's Office of Business and Economic Development (See Resume page).
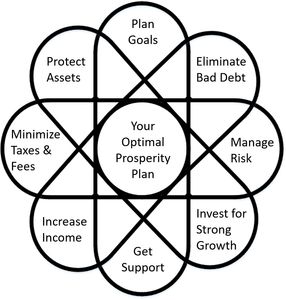
Goal Achievement - Your Optimal Prosperity Plan
Now, Austin uses the Optimal Solution Finder™ to do advanced mathematics for all kinds of clients: young and old, rich and poor, entrepreneurs and workers of all types.
Everyone likes it, because Advanced Mathematics helps clients achieve their goals faster and easier, with less risk and less money.